Visual Search using Deep Learning (pt. 1) - Model Architecture selection & Data preparation
Now that we have decided out task (Visual Similarity) and our application (Apparel Recommendation) we will begin our project.
First step
Before beginning any task, it is very important to take time and do a thorough literature review. I do feel like a hypocrite saying this as I often find myself making this mistake of not conducting a thorough survey and jumping to implementing a solution only to find myself starting again a week later when I find a paper presenting a better solution.
For visual search, I shortlisted a method described in a paper titled “Learning Fine-grained Image Similarity with Deep Ranking”)
Quick Summary:
The paper describes a three-way Siamese network which accepts three images (henceforth called a training triplet) in a go viz.
- Input image
- Positive image (An image visually similar to the input image)
- Negative image (An image visually dissimilar to the input image than the positive image)
The individual network in the 3-way siamese network is a VGG-16 + a shallow Convolutional Neural Network. The model individually passes each image of the aforementioned 3 through this network (same weights) and generates an embedding for each ie. output of the last dense of both networks.
Loss for a single pass of a single training triplet in the network is calculated as follows :
- Let
p,p+andp-be individual images of the training triplet. - Let
fbe the embedding function that will convert an image to its embedding vector. - Distance
Dbetween any 2 embedding vectors is calculated by taking squared differences between them.
Loss = max{0, g + D(f(p),f(p+)) - D(f(p),f(p-))}
wheregis the gap parameter to regularie the distance of the 2 image pairs.
Thus, in simple words, the model tries to generate an embedding for an image such that the distance between the image embedding and positive image embedding is less than the distance between the image embedding and negative image embedding.
Training set
Wait wait wait … So is this Supervised, you ask?
Do I need to make a million training triplets to use this?
Yes and no !
Let me explain…..
Yes you need labelled data for this model to train and you’re gonna need a lot of it……..but there is a smart way of generating these triplets. You could use traditional image similarity algorithms to generate these triplets.
In my case, I made use of image meta-data that was available. Let me show you my dataset.
import numpy as np
import pandas as pd
from tqdm import tqdm
import matplotlib.pyplot as plt

from PIL import Image
import random
import os
path = "../datasets/whole/"
Printing first 5 rows of image meta-data
df = pd.read_csv(path+"csv/sample_set.csv",sep='\t')
df.head()
| _category | _color | _id | _gender | _name | |
|---|---|---|---|---|---|
| 0 | dress-material-menu | Green | 1915297 | f | dress-material-menu/1915297_Green_0.jpg |
| 1 | dress-material-menu | Green | 1915297 | f | dress-material-menu/1915297_Green_1.jpg |
| 2 | dress-material-menu | Green | 1915297 | f | dress-material-menu/1915297_Green_2.jpg |
| 3 | dress-material-menu | Green | 1915297 | f | dress-material-menu/1915297_Green_3.jpg |
| 4 | dress-material-menu | White | 1845835 | f | dress-material-menu/1845835_White_0.jpg |
Let me tell you what these columns are.
_nameis the name-path to the actual image file_coloris the color of the apparel._categoryis the category of the product in the image viz. shirt, trouser, etc._genderis the gender that uses the product_idis the identification number of the product. As you can see from the above data, I was provided with multiple images of the same product.
Some statistics to get a feel of the metadata provided :
"""
Counting categories
"""
categories =  list(df._category.unique())
count = []
for c in categories:
    count.append((df["_category"]==c).sum())
category_probability = count/np.sum(count)
print("Number of categories : "+str(len(category_probability)))
Number of categories : 25
"""
Counting colors
"""
colors = list(df._color.unique())
count = []
for c in colors:
    count.append((df["_color"]==c).sum())
color_probability = count/np.sum(count)
print("Number of colors : "+str(len(color_probability)))
Number of colors : 47
I decided to sample images randomly according to their category frequency. Let me describe the the type of triplets I decided to come up with :
-
For a image, similar image is another image of the same product while the dissimilar is any other random image from the same category as selected image. (in-class negative)
-
For a image, similar image is another image of the same product while the dissimilar is any other random image from a category other than that of the selected image. (out-of-class negative)
-
For a image, similar image is another image of the same category and having same color while the dissimilar is any other random image from the same category as selected image. (in-class negative)
-
For a image, similar image is another image of the same category and having same color while the dissimilar is any other random image from a category other than that of the selected image. (out-of-class negative)
Down below is a highly inefficient triplet sampling function that generates the aforementioned 4 types of triplets :
def triplet_data_generator(count,dest):
    """
    Generates triplet

    Parameters
        count - int
            number of triplets to be generated
        dest - str
            location to write triplets
    Returns
        writes to a csv in destination
        every element in csv is index of product in sample_set.csv

    """

    triplet = pd.DataFrame(columns=("q","p","n"))
    for i in range(count):

        """Selecting query sample"""
        sample_category = np.random.choice(categories,p=category_probability) # select category
        sample_color    = np.random.choice(colors    ,p=color_probability   ) # select color
        temp = df[(df._category == sample_category) & (df._color==sample_color)]
        try:
            q_row = temp.sample()
            q_img = q_row.index.values[0]
        except:
            continue

        """Selecting positive sample"""
        # select in-class(30%) negative or out-of-class(70%) negative
        negative_type = True if random.random() < 0.3 else False

        if(negative_type):
            # in-class negative
            temp = df[(df._category == sample_category) & (df._color!=sample_color)]
            try:
                n_row = temp.sample()
                n_img = n_row.index.values[0]
            except:
                continue
            pass
        else:
            #out-of-class negative
            temp = df[(df._category != sample_category) ]
            try:
                n_row = temp.sample()
                n_img = n_row.index.values[0]
            except:
                continue
            pass
        """Selecting negative sample"""
        positive_type = True if random.random() < 0.1 else False
        # select different product with same color or different image of same product for positive

        if(positive_type):
            # different product same color
            temp = df[(df._category == sample_category) & (df._color==sample_color)]
            try:
                p_row = temp.sample()
                p_img = p_row.index.values[0]
            except:
                continue
            pass
        else:
            # same product different image
            temp = df[(df._id == list(q_row["_id"])[0])]
            try:
                p_row = temp.sample()
                p_img = p_row.index.values[0]
            except:
                continue
            pass
        """Insert in dataframe"""
        triplet.loc[i] = [q_img,p_img,n_img]
        if(i%5000==0):
            print(str(i)+" completed")
            triplet.to_csv(dest,sep='\t',index=False)

    triplet.to_csv(dest,sep='\t',index=False)
triplet_data_generator(800000,path+"csv/triplets.csv")
temp = pd.read_csv(path+"csv/triplets.csv",sep='\t')
temp.head()
| q | p | n | |
|---|---|---|---|
| 0 | 125610 | 125612 | 664796 |
| 1 | 409528 | 409526 | 336219 |
| 2 | 95883 | 95883 | 48374 |
| 3 | 658843 | 658842 | 270175 |
| 4 | 520477 | 520476 | 127710 |
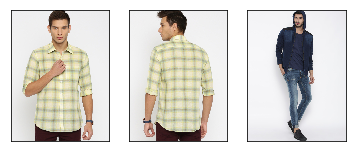
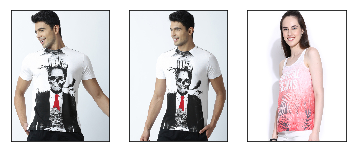
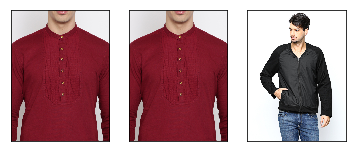
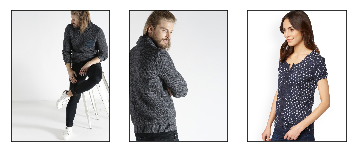
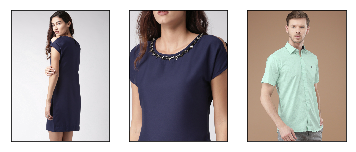
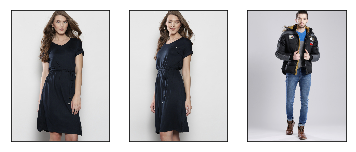
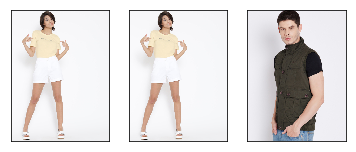
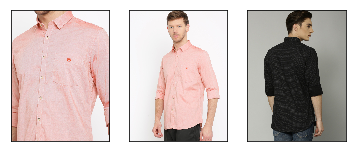
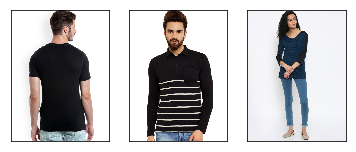
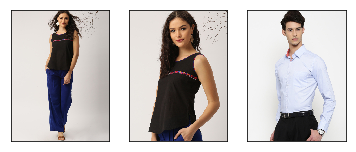
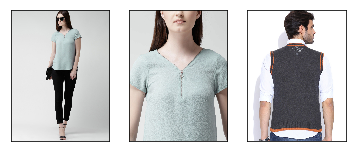
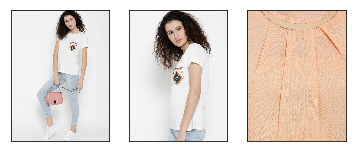
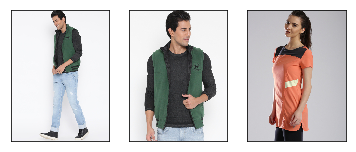
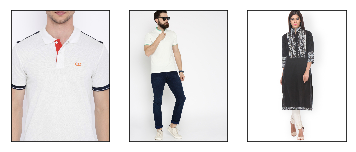
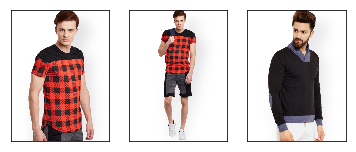
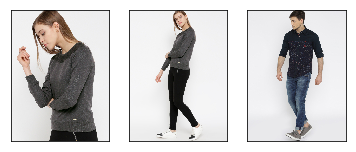
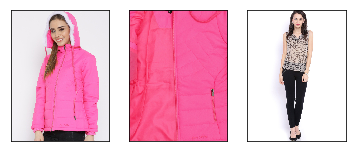
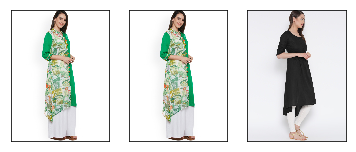
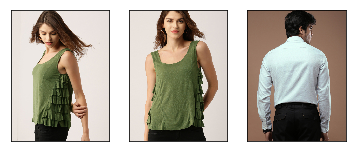
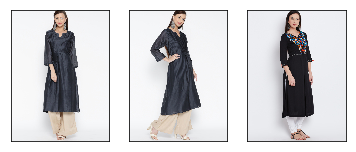
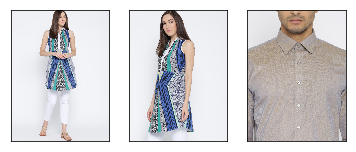
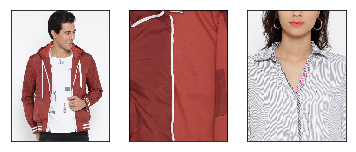
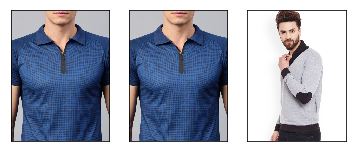
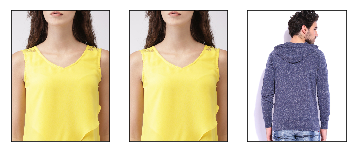
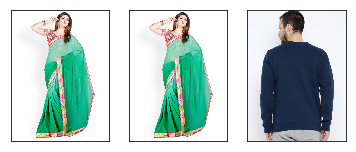
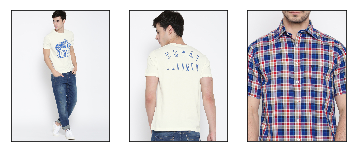
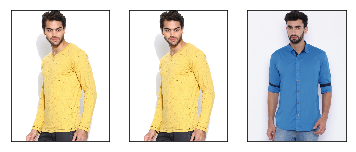
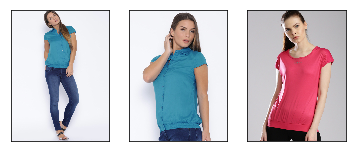
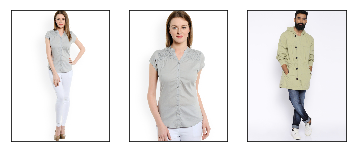
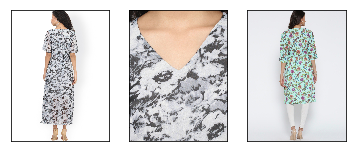
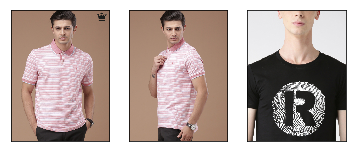
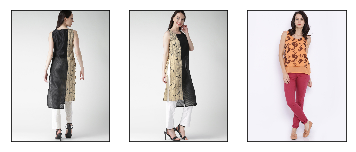
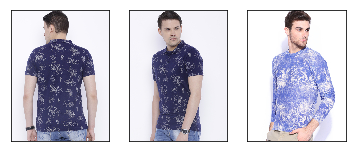
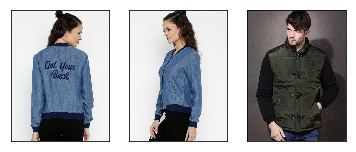
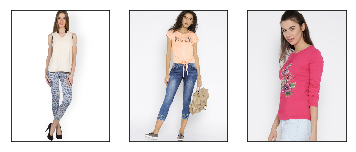
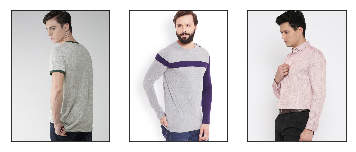
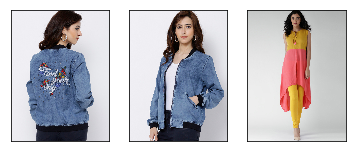
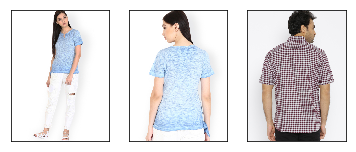
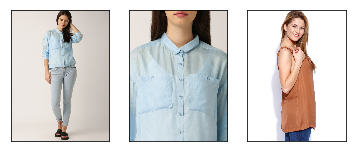
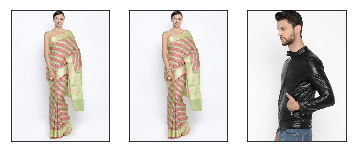
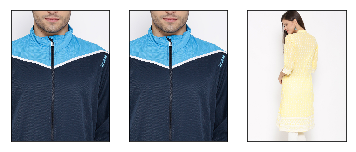
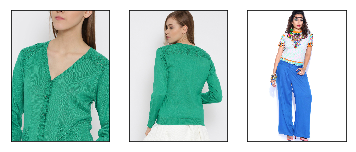
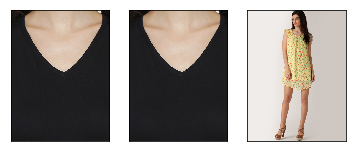
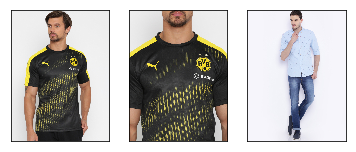
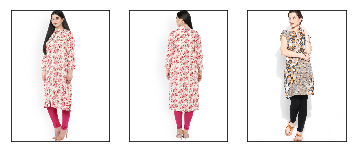
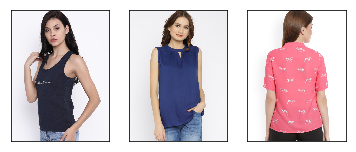
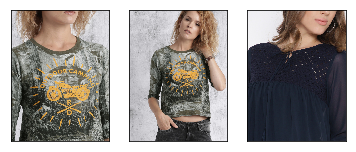
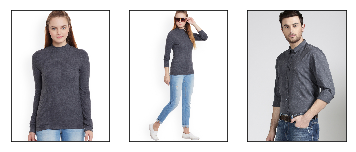
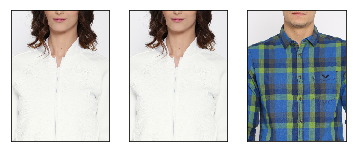
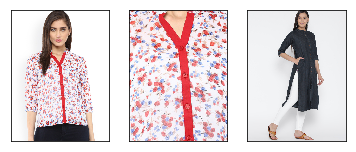
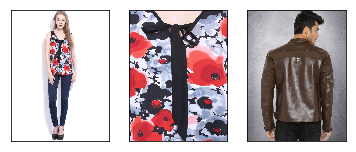
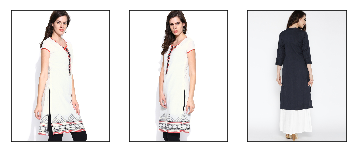
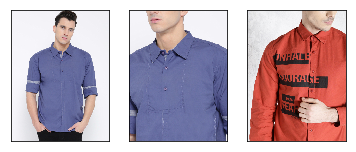
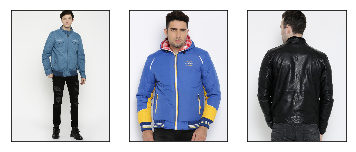
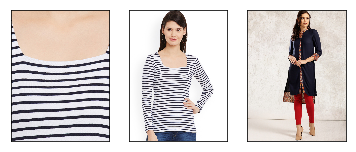
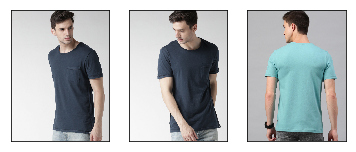
Each row in this csv contains a triplet. Every number is the index of a corresponding image in the previous csv.
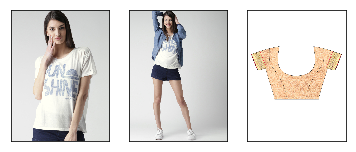
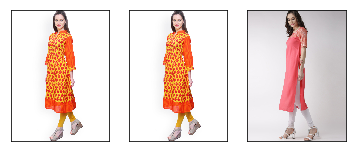
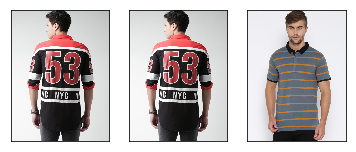
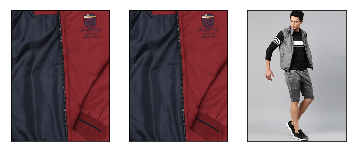
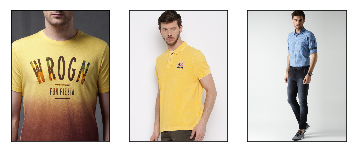
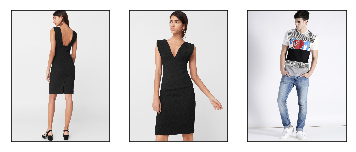
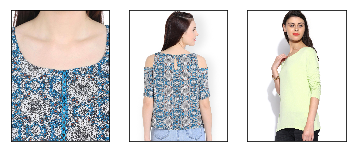
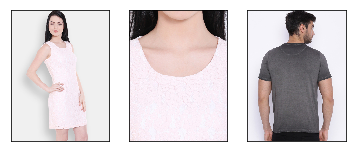
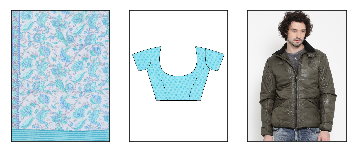
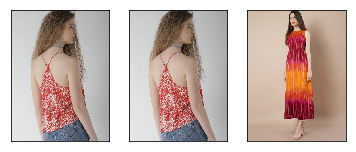
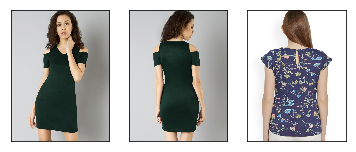
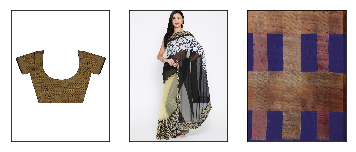
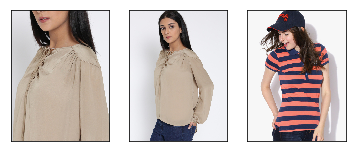
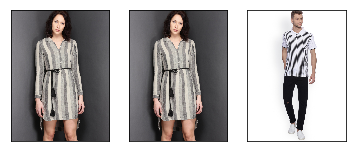
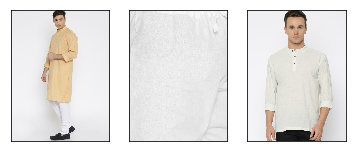
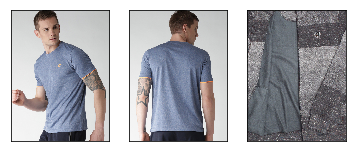
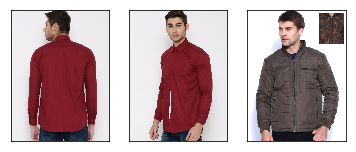
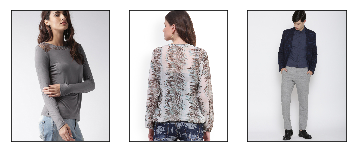
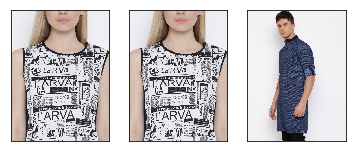
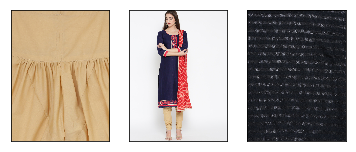
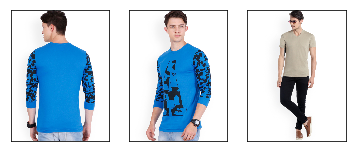
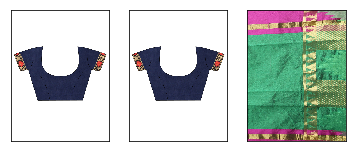
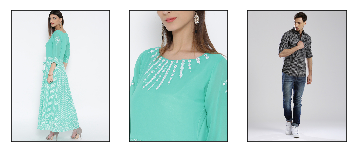
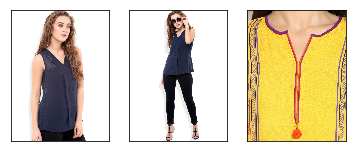
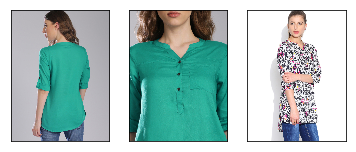
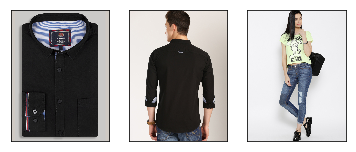
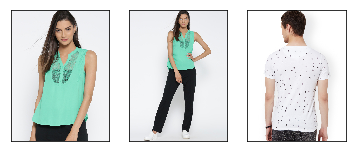
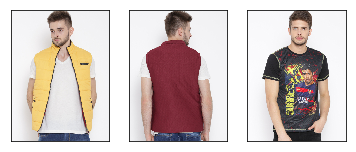
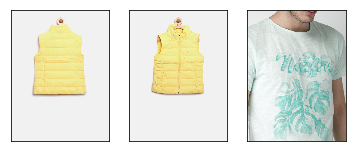
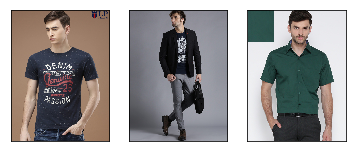
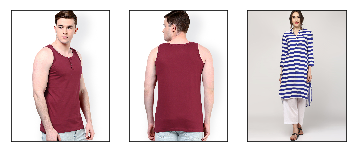
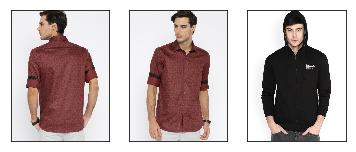
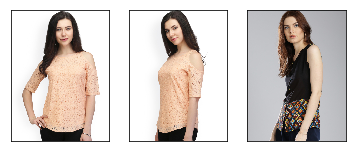
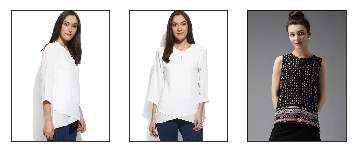
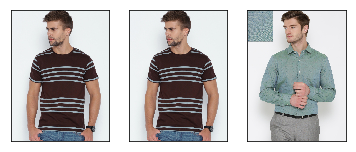
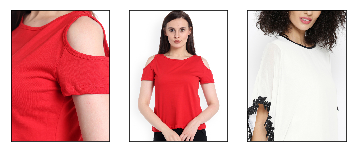
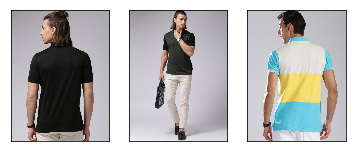
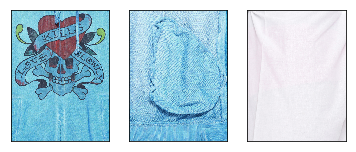
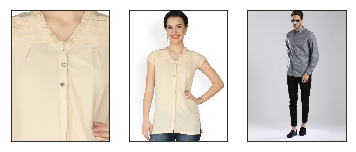
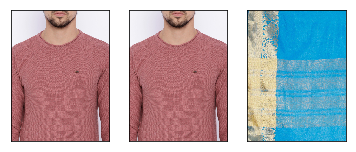
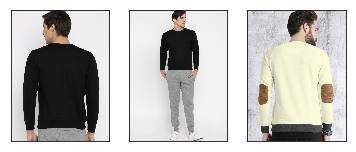
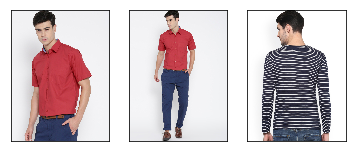
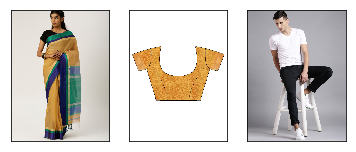
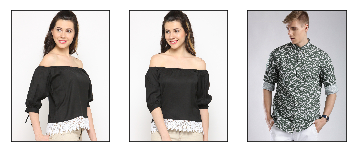
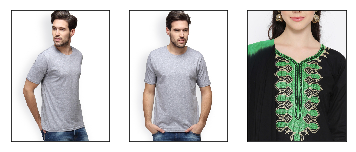
Let us visualize a few of them now :
path2i = path + "images/"
for index, row in temp.iterrows():


    i1,i2,i3 = row["q"],row["p"],row["n"]

    i1 = list(df.loc[[i1]]["_name"])[0]
    i2 = list(df.loc[[i2]]["_name"])[0]
    i3 = list(df.loc[[i3]]["_name"])[0]


    try:
        ii1 = Image.open(path2i+i1)
        ii2 = Image.open(path2i+i2)
        ii3 = Image.open(path2i+i3)

        fig = plt.figure()
        ax1 = fig.add_subplot(1,3,1)
        ax1.set_xticks([])
        ax1.set_yticks([])
        ax1.imshow(ii1)


        ax2 = fig.add_subplot(1,3,2)
        ax2.set_xticks([])
        ax2.set_yticks([])
        ax2.imshow(ii2)


        ax3 = fig.add_subplot(1,3,3)
        ax3.set_xticks([])
        ax3.set_yticks([])
        ax3.imshow(ii3)
        plt.show()
    except:
        continue


    if(index == 100):
        break
    pass
I will be printing 100 triplets for you to see how easily I managed to generate high quality labelled data. If you reach the comments section down below, let me know if you know a better sampling strategy or a better implementation of my current sampling strategy. We will see the implementation of the network in the next post.
